Xmrit (pronounced ‘xam-mer-it’) is a free tool by Commoncog to help business operators quickly create and share XmR charts.
What is an XmR chart?
An XmR chart helps you analyse your data. In a sentence: it helps you separate signal from noise. It is particularly useful to business operators.
To understand this, let’s talk about a problem with interpreting data that everyone should be familiar with.
Let’s say that you open a business dashboard to look at some metric. The metric goes up and down.
That’s nice. Now what?
What does the chart tell you? If it goes up, is this good? If it goes down, is this bad? What should you do in response to what you see?
If you’re like most folks, you probably don’t know. You’ve probably had the experience where you open an analytics tool and felt a little … confused. You don’t know what to investigate. You don’t know if a number going up is good, or if a number going down is bad, or whether it’s all just business as usual.
Understanding variation is a big deal
Here’s a fact: all business metrics display some variation. It’s perfectly normal for numbers to wiggle up and down on a routine basis.
The question you want to ask is this: when a metric changes, is this a signal? Or is this simply routine variation — that is, noise? Should I investigate, or can I safely ignore it?
If you don’t know how to answer this question, you won’t be able to become data driven.
In fact, this ‘problem of dealing with variation’ leads you to a number of other potential problems:
Problem 1: You don’t know if you’ve improved
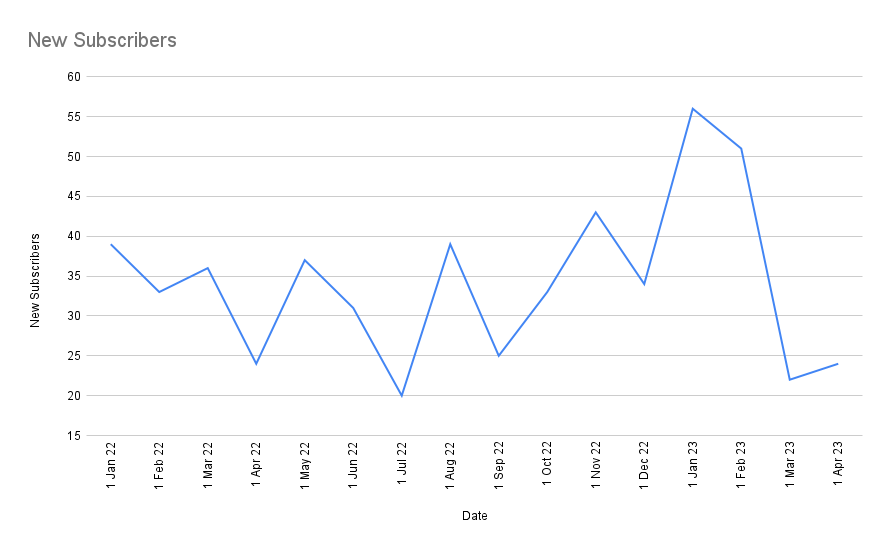
Let’s say that you want to test if a new sales process is more effective. You make a change to the way Marketing Qualified Leads are vetted and wait a few weeks. Then you take a look at your data:
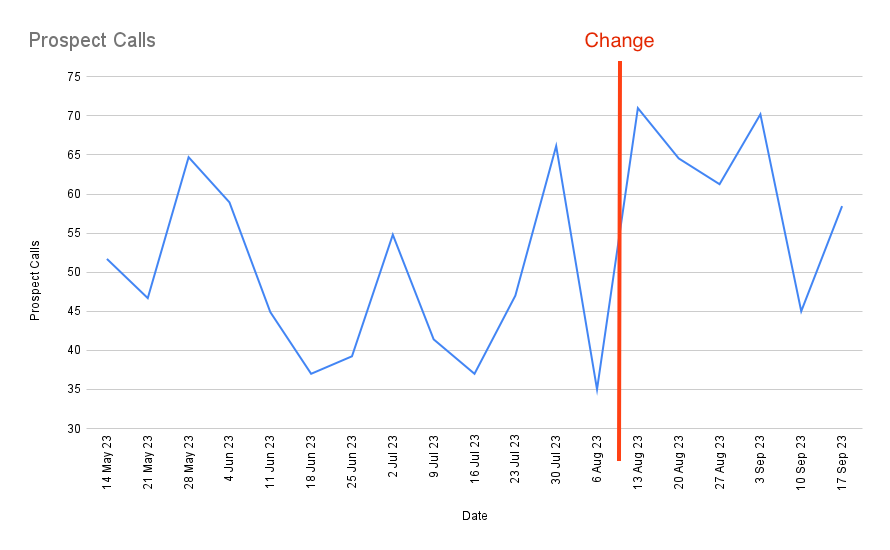
Did it work? Hmm. Maybe wait a few more weeks?
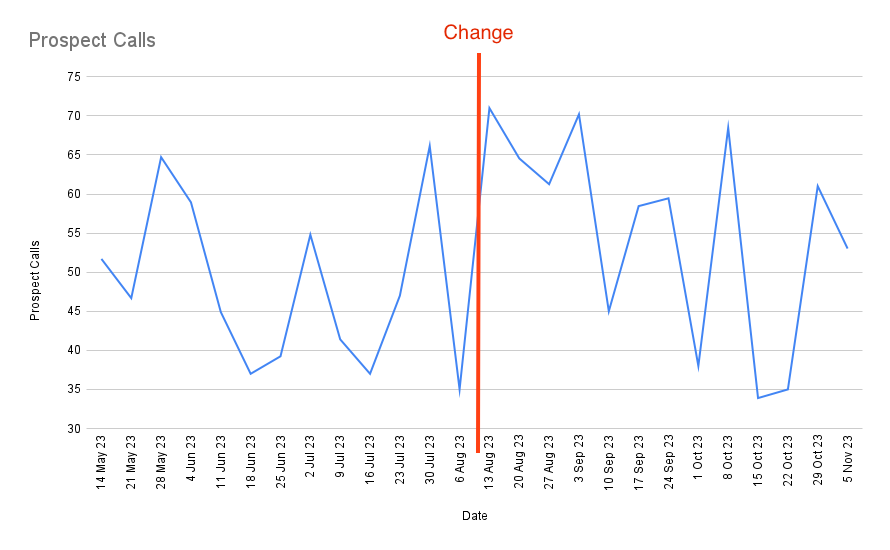
Did it work? Did it fail? Hmm. Perhaps it’s made an impact on some other metric? You take a look at a few other sales metrics but they’re all equally wiggly. You discern no clear pattern; you chalk it up to a “maaaybe?” and move on to the next idea. You don’t get any feedback on your moves. You’re like a blind archer, shooting arrows into the dark.
Problem 2: You waste time chasing noise
Your boss opens up the sales meeting and says “Sales is down 21% for the month! This is very bad! We’re no longer on track to hit our quarterly targets!”
You’re told to look into it. You spend a huge amount of time investigating, and it turns out that … you can’t find anything wrong. Perhaps this is just routine variation?
Your boss doesn’t understand that, of course. He doesn’t understand that routine variation exists (if he did, he wouldn’t have asked you to investigate). So you make up some explanation, he accepts it, and then next month the number goes up again and everyone breathes a sigh of relief.
Until the next time the number goes down. Then you get yelled at again.
This all quickly becomes kabuki theatre.
Problem 3: You may set dumb SLAs
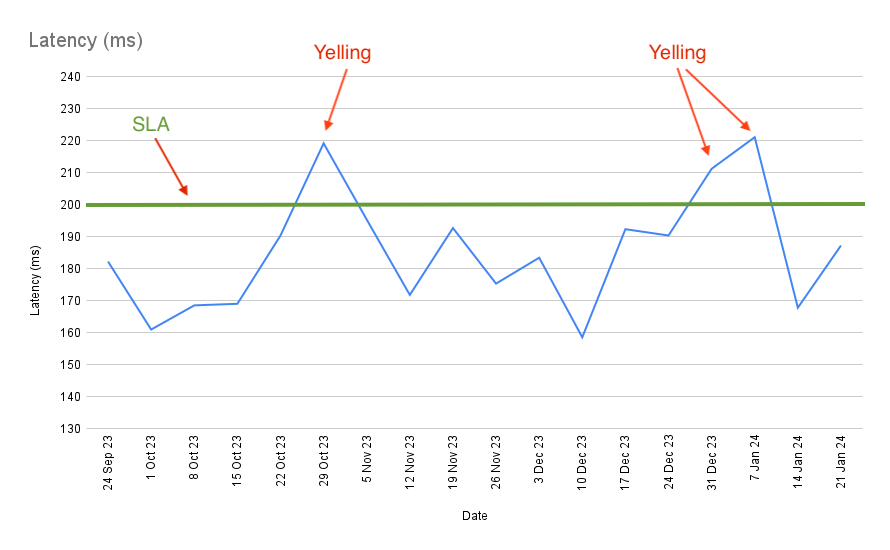
You’re in charge of data infrastructure. You have a maximum latency SLA (Service Level Agreement) for some of your servers. Every week your latency metrics are piped into a Slack channel, with a % change.
Every two months or so, the latency for a key service violates your SLA. You get yelled at. “WHAT WENT WRONG?” your boss sends over the channel, tagging you.
You investigate but can’t find anything wrong. It doesn’t cross your mind that perhaps the process’s natural wiggling will — for some small % of the time — violate the SLA.
The end result
As a result of these and other problems, you stop taking metrics seriously because you learn so little from them.
Or you learn to dread ‘number go down’, because you know you’ll be asked to investigate. You don’t feel in control of your numbers. You feel like they kick you around.
And, finally, sadly, management learns that ‘yell at employees when number goes down’ often results in the number going up … although whether this is by random chance is anybody’s guess.
But what if there’s an alternative …
Let’s pause for a moment and imagine: what if there’s a magical tool that can consume a series of numbers and then tell you what to investigate.
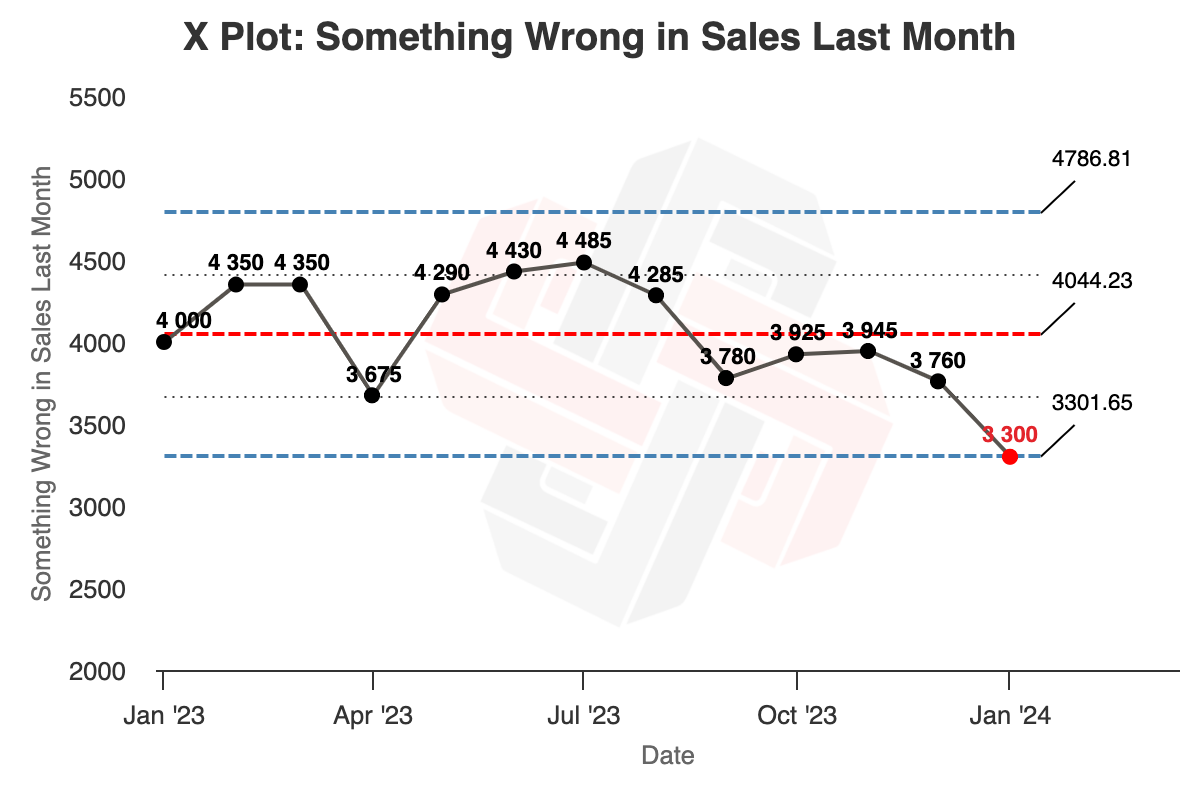
For instance, it might tell you: “Something went wrong with sales last month! Investigate now!”
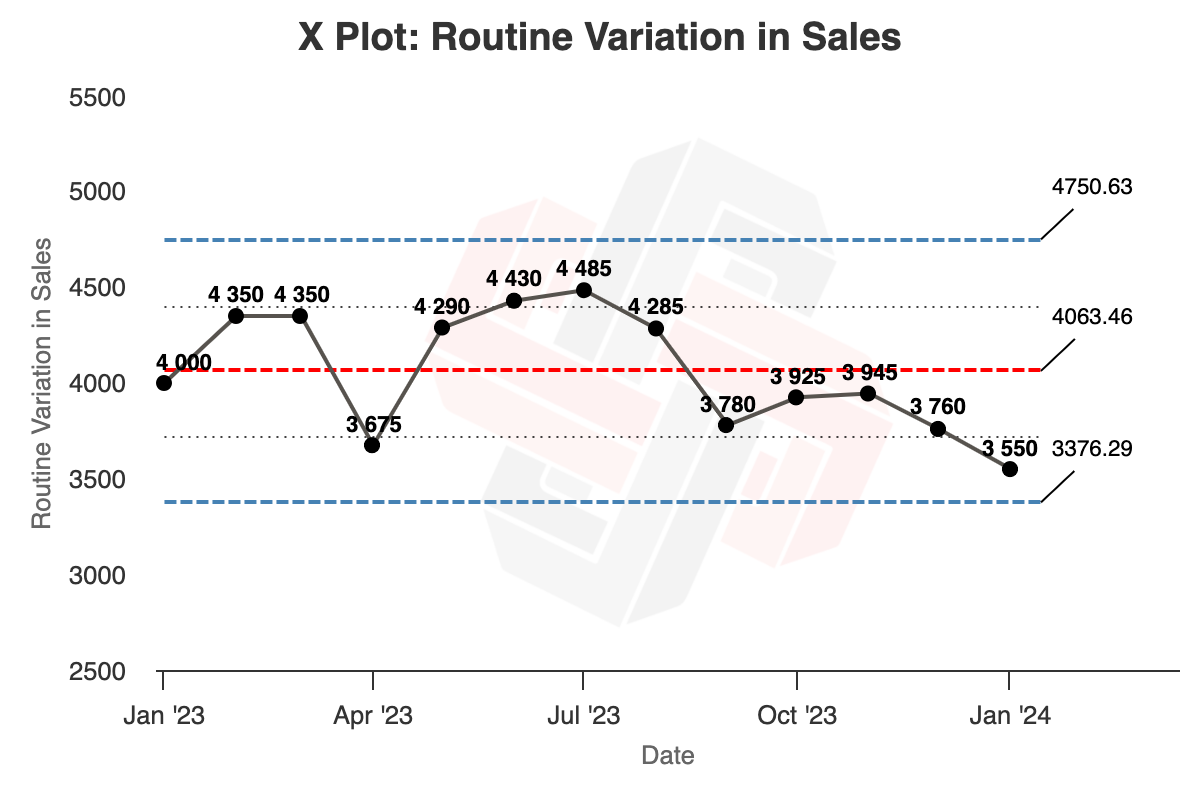
Or perhaps it might tell you to ignore things because everything is just routine variation.
Well, this is what XmR charts do. And they’re radically simple to understand.
How XmR charts work
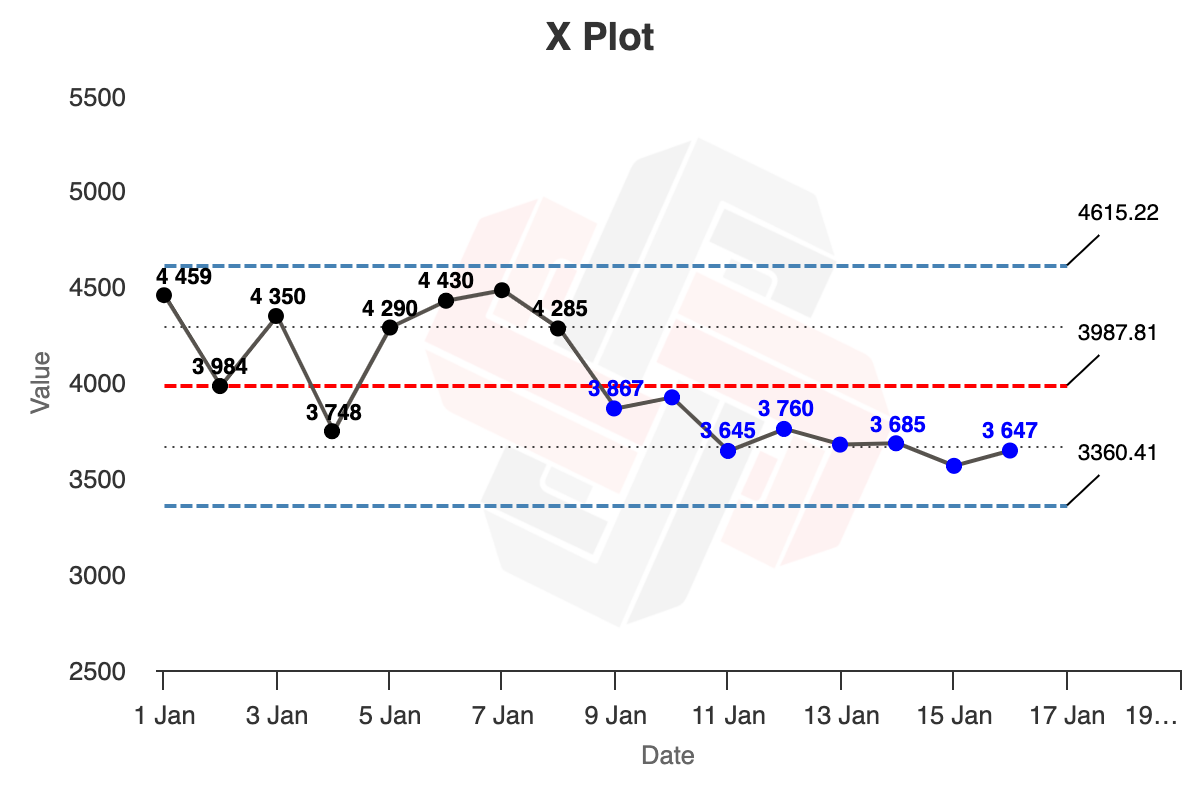
This is what an XmR chart looks like:
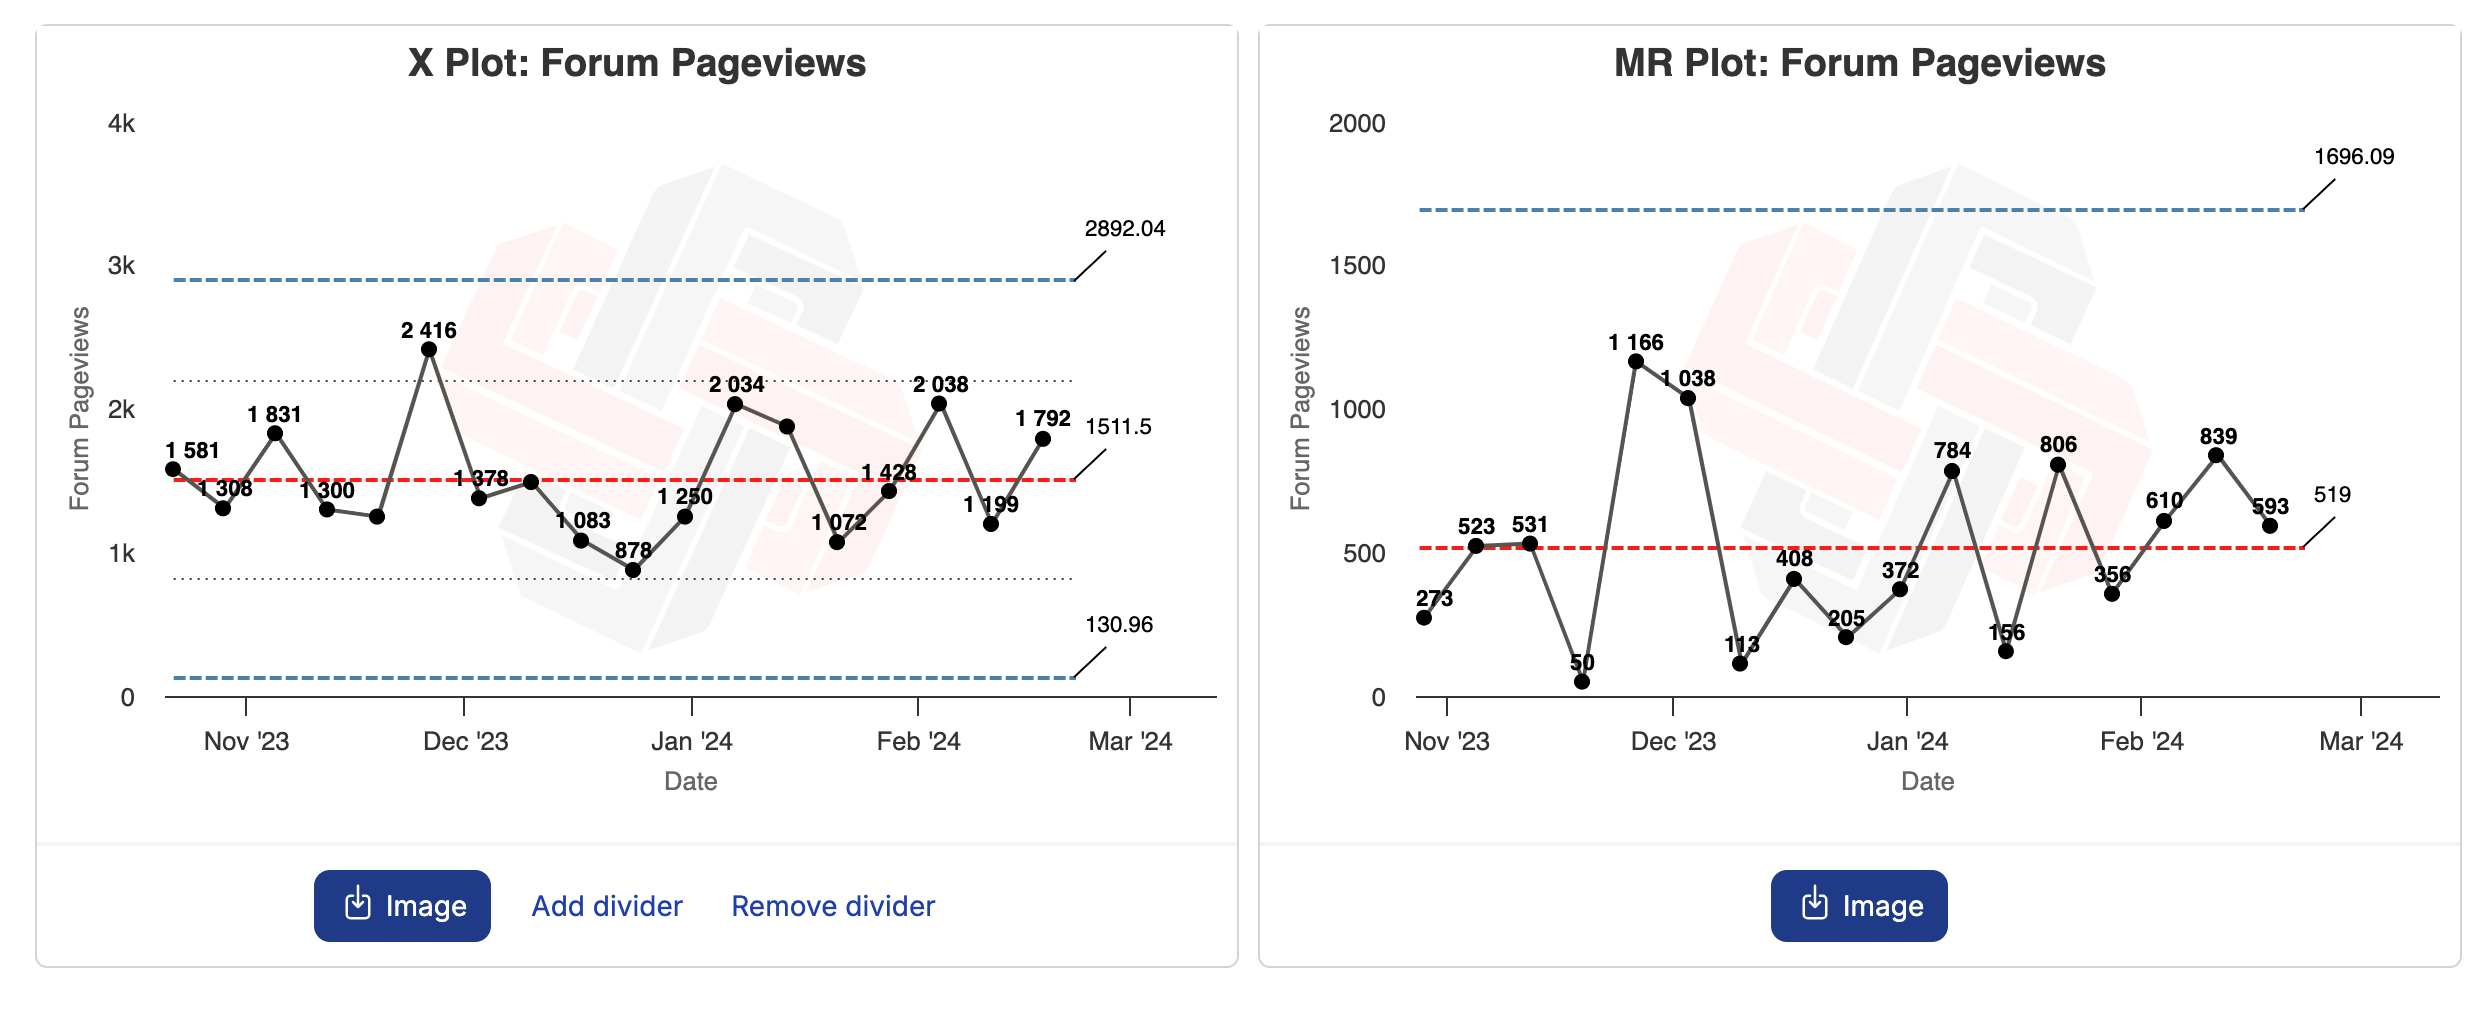
XmR charts are so named because they consist of an ‘X’ chart (the ‘X’ variable, or the metric you care about), and a ‘Moving Range’ chart, which shows differences from point to point.
XmR charts have only three basic rules.
Rule 1: Process Limit Rule
Rule one states that if a point lies outside the limit lines (the blue lines), on either the X chart or the MR chart, something unusual is going on.
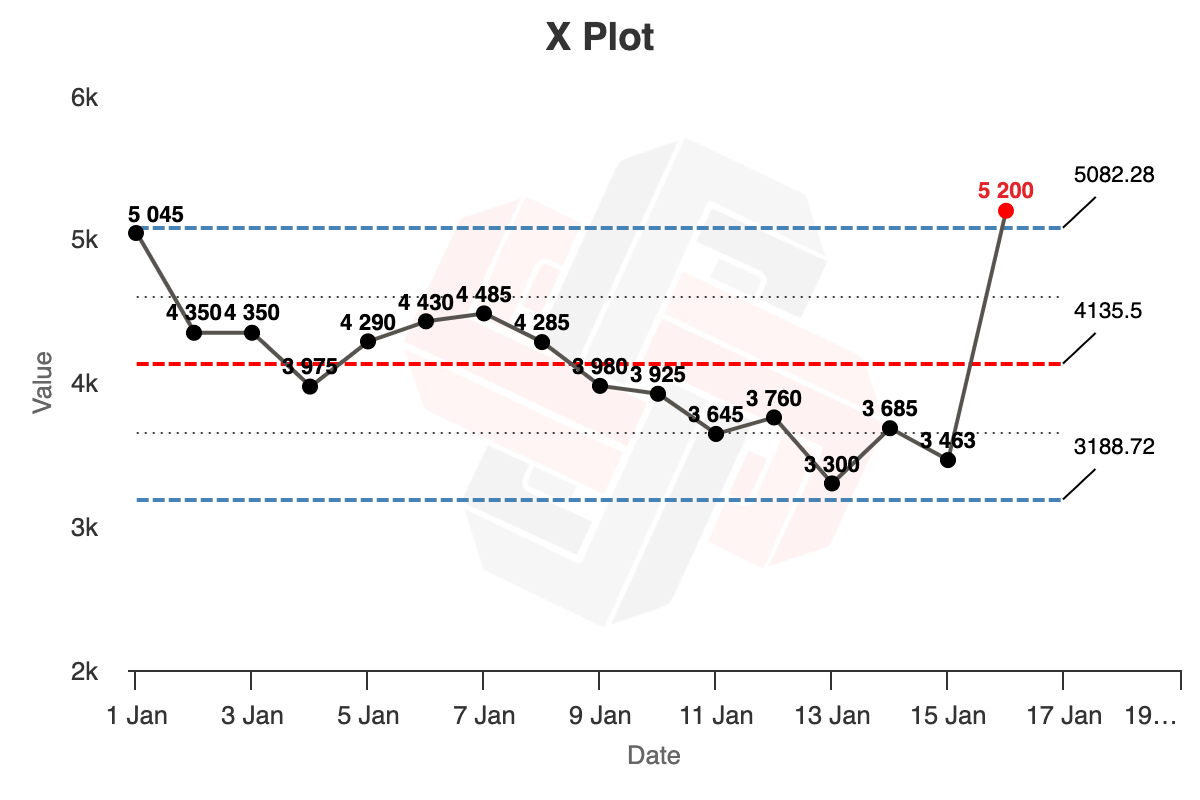
You should investigate!
Rule 2: Quartile Limit Rule
Rule two states that if you have a run of three out of four successive points that is closer to the limit lines (blue dotted lines) than the centre line (red dotted line), then this is a moderate source of exceptional variation and you should investigate.
Another way of thinking about this is that you need three out of four successive points beyond a quartile limit (the dotted line in between the limit and centre lines).
In the image below, three out of four of the yellow points are closer to the lower process limit line (in blue dotted line), then the average line (in the centre, in red).

This is a moderate source of exceptional variation. Something odd has happened. You should investigate!
Rule 3: Runs of Eight
Rule three states that if you have data points in a row on one side of the average (red) line, this is a weak source of special variation and you should investigate.
Wait, why does the XmR Chart Work?
Here’s the intuition behind why XmR charts work: all processes show some amount of routine variation, yes? We may characterise this variation as drawing from some kind of probability distribution. What kind of probability distribution? Well, we don’t really care.
What the XmR chart does is to detect the presence of more than one probability distribution in the variation observed in a set of data. We do not care about the exact nature of the probability distributions present, only the number of them.
If your process is predictable, the variation it shows may be said to be ‘routine’, or to draw from just one probability distribution. On the other hand, when you’ve successfully changed your process, the data you’ll observe after your change will show different variation from before. We can say that your time series will show variation drawn from two probability distributions. Also: if some unexpected, external event impacts your process, we may also say that we’re now drawing from some other probability distribution at the same time.
The XmR chart does this detection by estimating three sigma around the average line. For the vast majority of real world processes, most routine variation will fall within three sigma of the average.
If a point falls outside the three sigma limits, something exceptional is going on — there’s likely another source of variation present. The other two detection rules are run-based (they depend on sequential data points in a time series) and are designed to detect the presence of moderately different probability distributions. For the vast majority of real world distributions, XmR charts will have a ~3% false positive rate (source). This is more than good enough for business experimentation.
This intuition helps explains both the power as well as the limitations of the XmR chart.
Where can I find more information?
We intend to add a lot more information to xmrit.com in the near future. If you want to use XmR charts in practice, you should probably skim through the User Manual, which includes some practical tips for XmR chart usage (in addition to explainers on how to use the Xmrit tool).
If you’d like an explainer of how XmR charts might lead to company-wide data-driven operations, you’ll probably want to read the essay Becoming Data Driven, From First Principles over at Commoncog.
If you’d like more advanced information about XmR charts, your best source of information is likely (in increasing order of complexity):